- Equate SEO metrics to money for executives
- Comparing SEO metrics vs. competitors
- Market landscape view
- Competitor SEO scorecards
- Compare individual metrics
- Content opportunities
- Competition monitoring
- SEO metrics for your website
- YoY and MoM statistics
- YoY trends
- Brand vs. non-brand breakdown
- Critical page and keyword monitoring
- Enterprise SEO scorecards
- Rankings
- Winners & losers for pages and keywords
- New & lost for pages and keywords
- Content performance
- Index coverage errors
- Status or project reports
- Also check out our API & Looker Studio reports
Enterprise SEO metrics are key performance indicators (KPIs) used to measure the effectiveness of your SEO efforts. Monitoring these metrics helps you prove value and shows the success of your SEO program.
You’ll create a lot of different SEO reports for a lot of different people in an enterprise environment. Let’s look at some of the reports you’ll want to create and the metrics to include in them for different people.
Money is what businesses care about. It’s the end result of all of your SEO efforts. If you can show your SEO initiatives had an impact on the bottom line of the business, then you’ll get more buy-in and resources.
You want to report on revenue, or any metrics that are closely related to money. Most of this is going to come from your own business data.
Here are some enterprise SEO metrics related to money:
- Revenue. This is as direct of a number as you can get. It’s not often easy to get to though. In many cases, you’ll be combining data from a lot of sources and taking partial credit as part of a multi-touch attribution system.
- Sales Qualified Leads (SQLs). These are leads your sales team has determined are potential customers.
- Marketing Qualified Leads (MQLs). Leads generated from marketing.
- Conversions. When a lead has performed some action you wanted them to take.
- Customer Lifetime Value (LTV). The average revenue a customer will generate over their lifetime with a business.
- Customer Acquisition Cost (CAC). The total cost of acquiring a new customer.
- Opportunity value. For these, you typically create a few scenarios saying if I do these things, this is what I forecast the results will be. So if you want to do a project like cleaning up redirects, you can say this is the number of links you’ll reclaim, this is the value of a link or cost of buying a link, and you can come up with a value number for the project.
- Return on Investment (ROI). This is how much you make in return for an investment of money after you account for your costs. You may see this as a yearly number or based on things like the total lifetime value of a customer.
- Cost efficiency. Saving money can be as important as seeing an increase in revenue. Typically you will find synergies with PPC and SEO teams such as using the same landing page for both instead of each team creating their own pages. Or you may choose to cut spending on paid ads for branded terms if no competitors are bidding on them, since that traffic will just go to organic instead.
In an enterprise environment, you’ll be fighting other teams for resources or budget. You need to be able to show why your company should invest more in SEO vs. other channels. If another channel is better at showing their value, they will get additional funding that could have gone to your team and your initiatives.
Check out our guide on enterprise SEO for more tips on how to be successful in this environment.
Another way to get buy-in at companies is to compare your site vs. your competitors. This relies on a more emotional sales play. No one wants to lose to their competitors!
If you can show that you’re losing or falling further behind on various SEO metrics, it makes it much easier to argue for additional funding and resources to carry out the projects you believe will have the biggest impact.
Market landscape view
For a high-level overview of the competitor landscape that is visually appealing, check out the Organic Competitors report in Ahrefs’ Site Explorer. This shows you three different metrics at a glance including Organic Traffic Value, Organic Traffic, and the number of pages on the site. You can also use a list of custom sites for the visualization if there are certain competitors you want to show.

You can add a date comparison such as this year vs. last year to show how the market has evolved over a period of time.
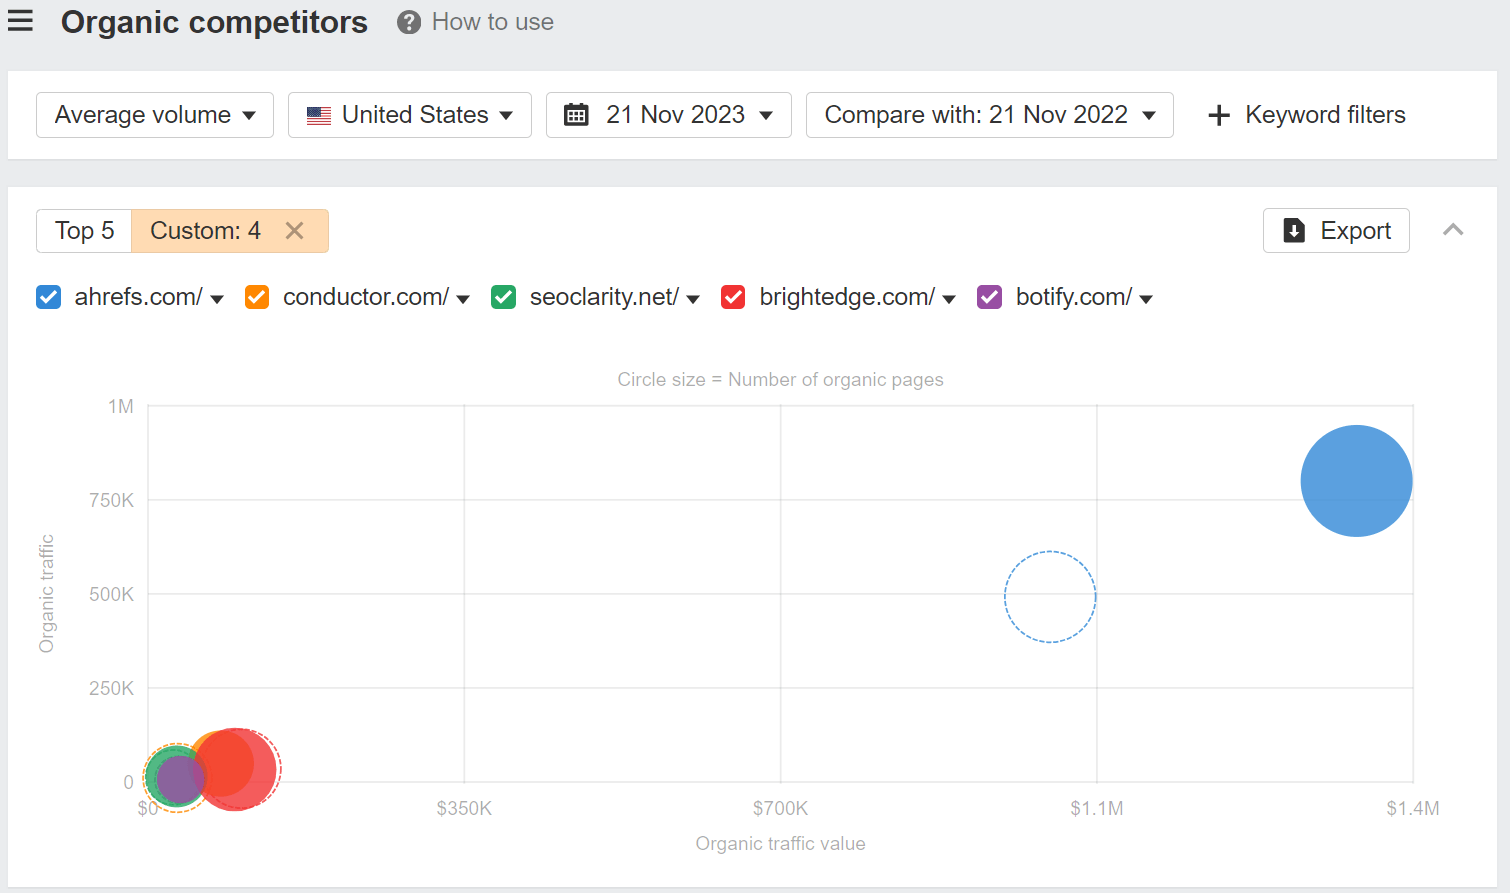
The report will also work with more than just domains. You can plug in a specific website path or page if you’re reporting to a particular group or product team and need a more narrow view.
Competitor SEO scorecards
Competitor SEO scorecards offer an in-depth view of your performance against competitors, showcasing areas of strength and areas for improvement.
These can be done a number of different ways. You’ll often see some all-in-one scorecards with different sections like website health, visibility, and links. Other times these will be individual scorecards broken out into different sections. They typically include changes to the values such as MoM or YoY numbers.
Some metrics you may want to include in a competitor scorecard:
- Share of Traffic Value (SoTV)
- Share of Voice (SoV)
- Traffic Value
- Traffic
- Organic Pages
- Links
- Referring Domains
- Website Health
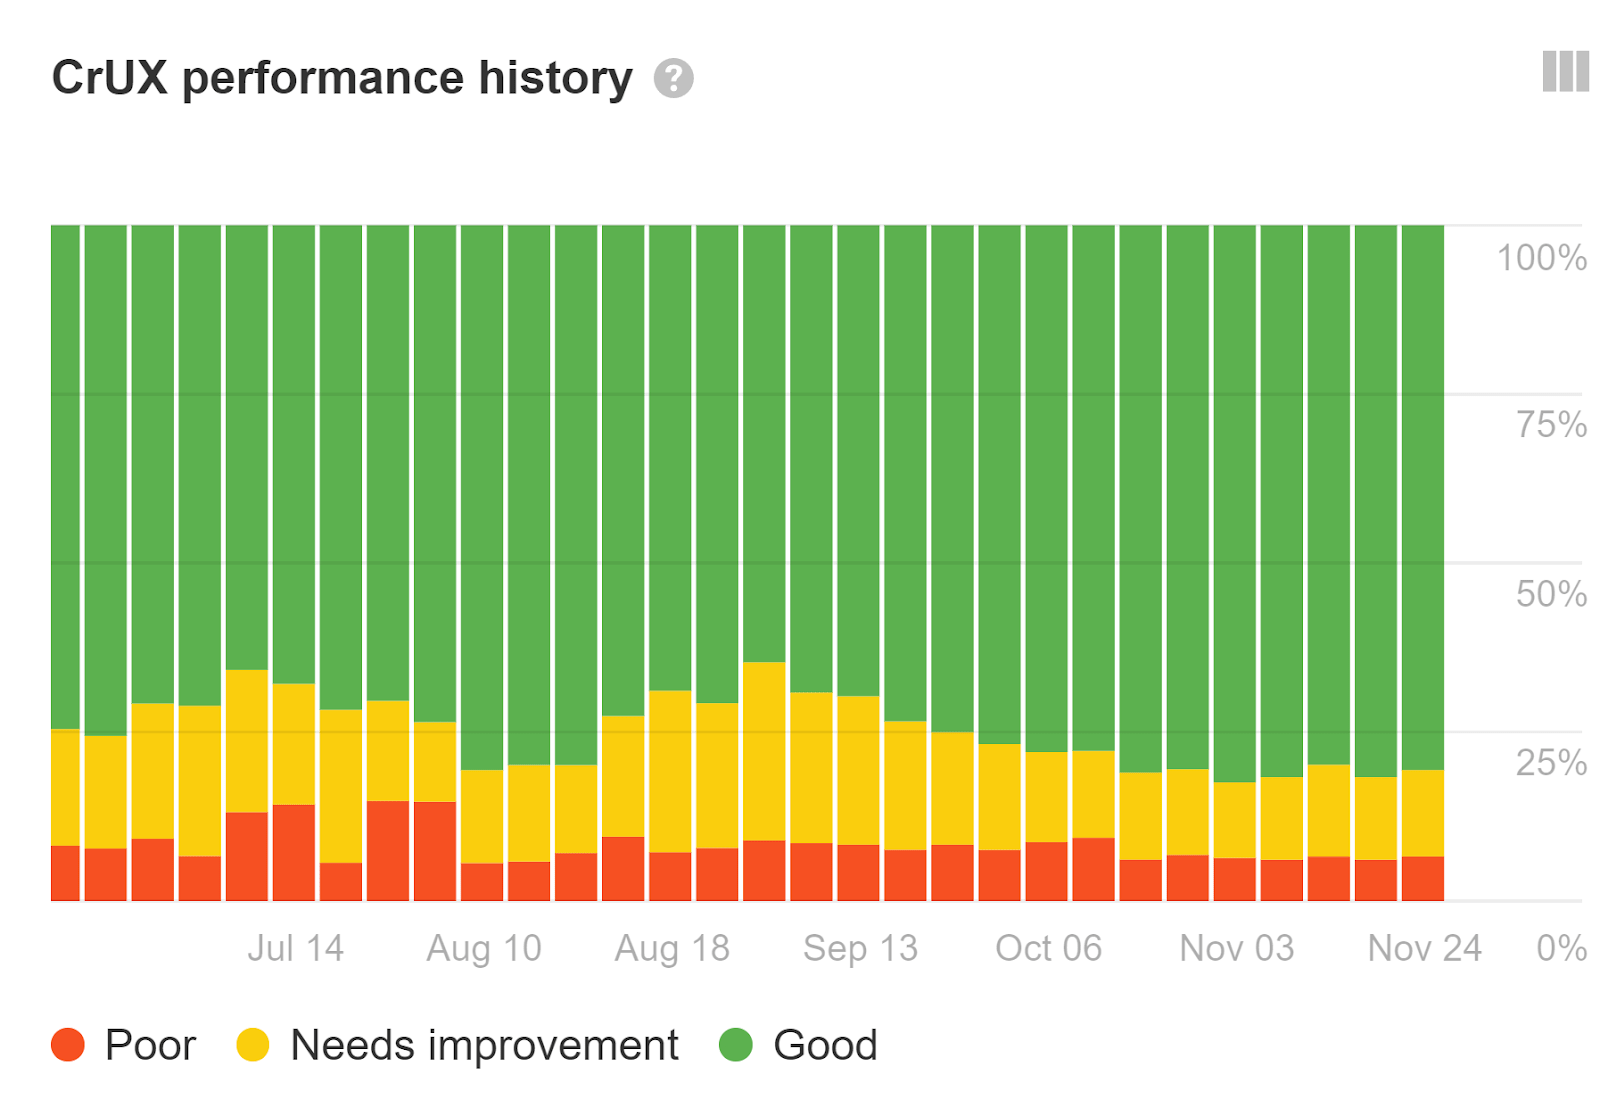
- Core Web Vitals
- Average Content Scores
SoV is commonly used, but I feel like I should explain SoTV since I haven’t seen this mentioned anywhere before. SoTV takes SoV a step further by equating it to money, which execs would like more. It helps identify your share of valuable traffic instead of traffic in general. I believe it is a stronger metric than SoV to use for reporting, but you could use both.
Our Traffic Value metric is what it would cost to buy ads for all of the organic traffic you get. The formula to calculate SoTV would be similar to calculating SoV. Here’s the calculation:
Your Traffic Value / (Total of your Traffic Value + the Traffic Values of each of your competitors) x 100
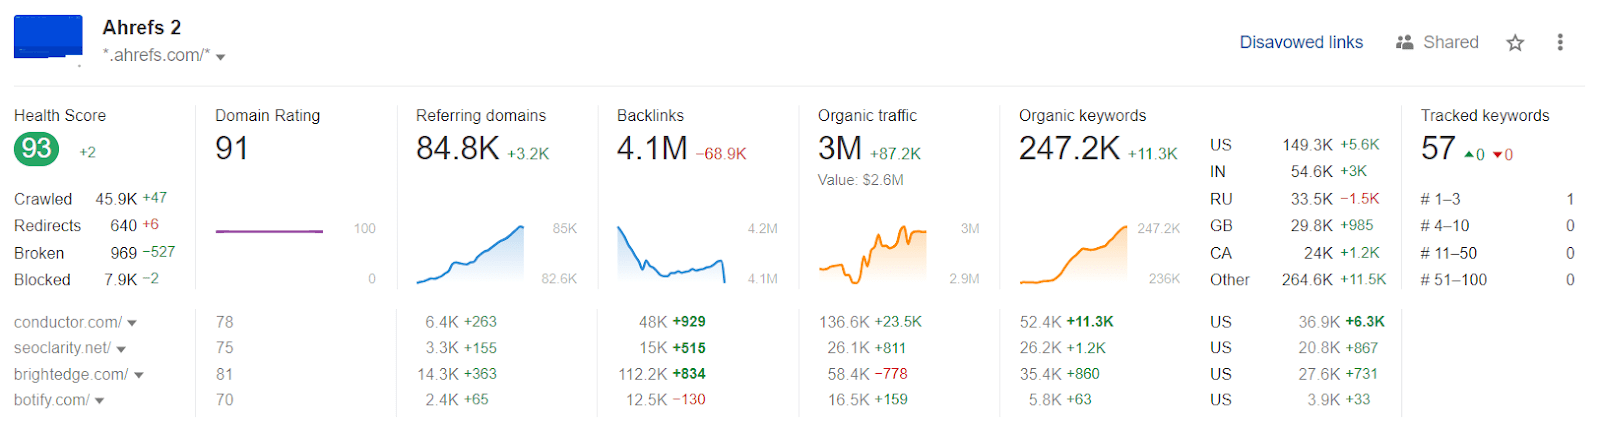
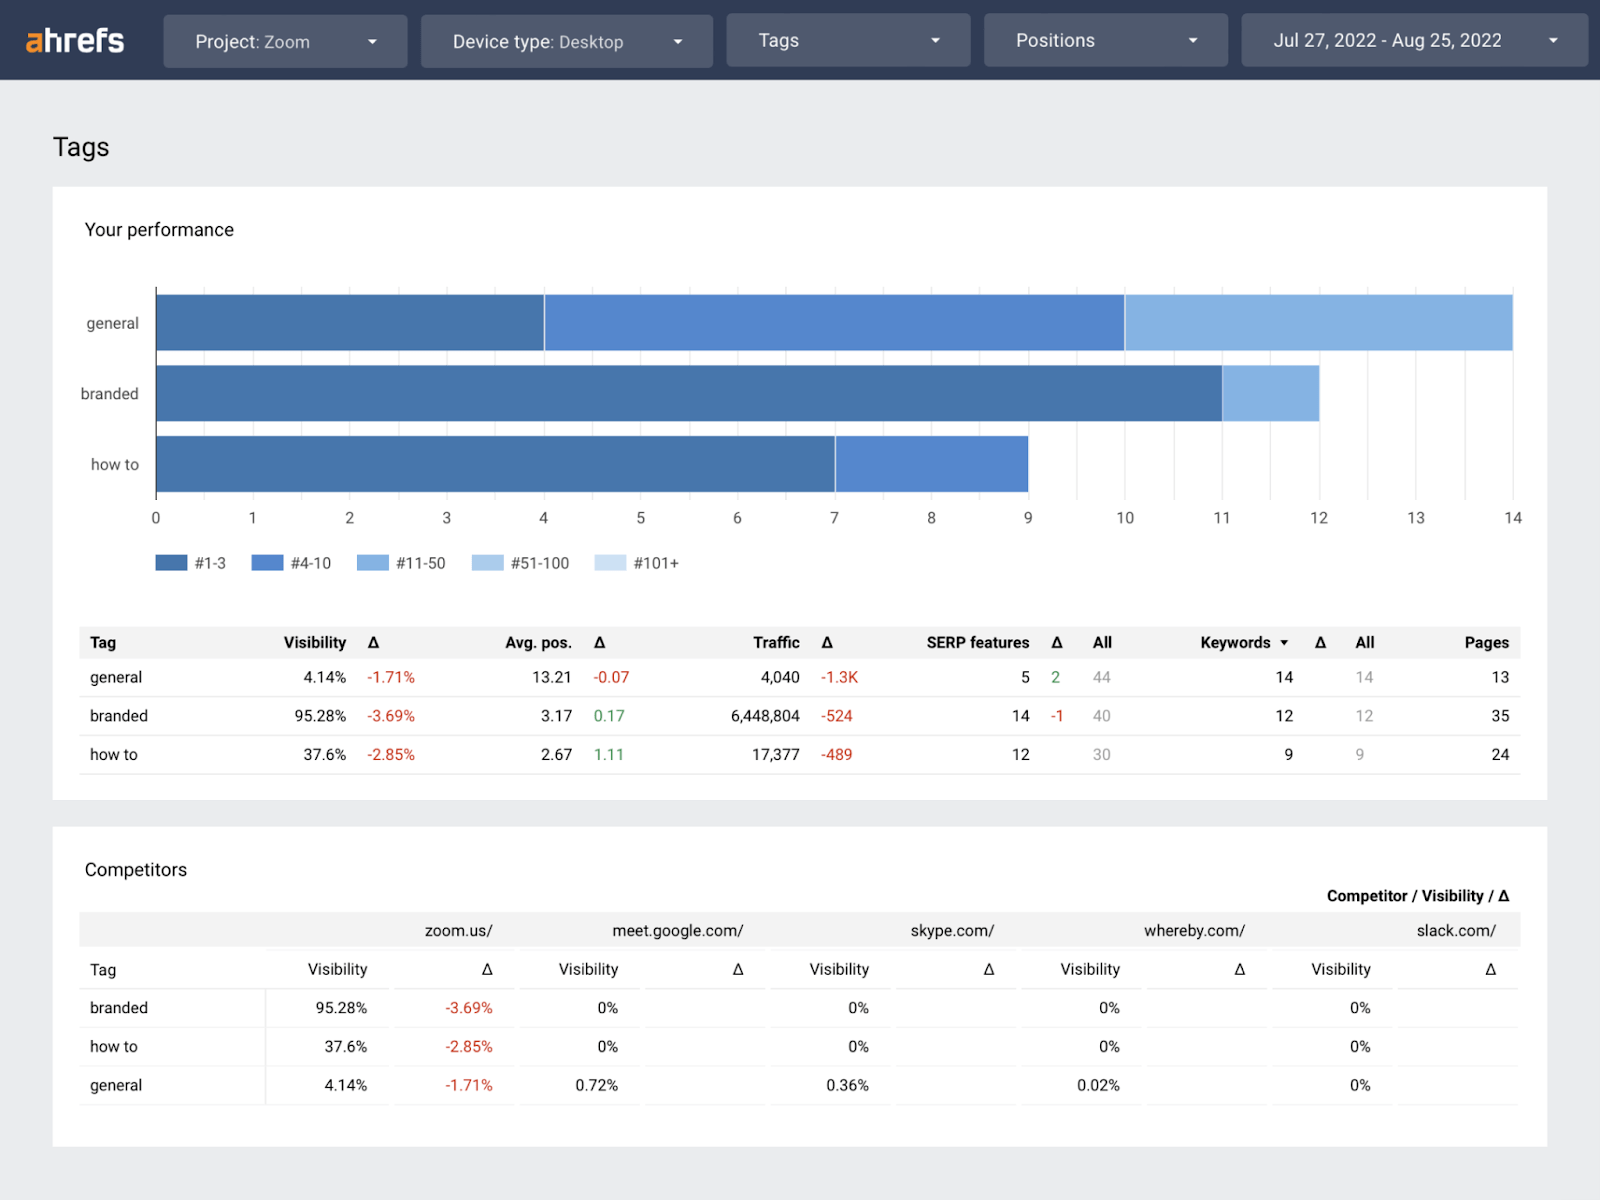
We don’t have exactly what I’d want for a competitor scorecard view in Ahrefs yet, but the data exists in many parts of the tool and you could pull the data with the API to create your own scorecard. We also have some views that are close like the competitor view on the Dashboard.
Compare individual metrics
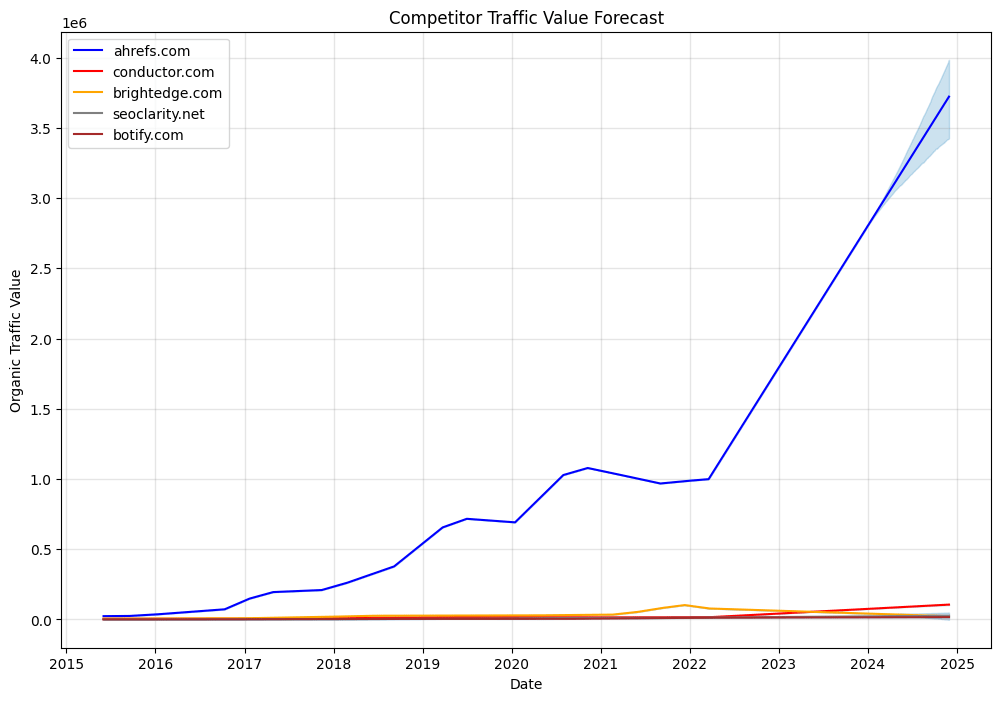
You may want to show individual metrics over time vs. competitors. The main chart in Overview is made to do exactly that. You can compare multiple metrics including:
- Organic traffic value
- Organic traffic
- Referring Domains
- Domain Rating
- Organic pages
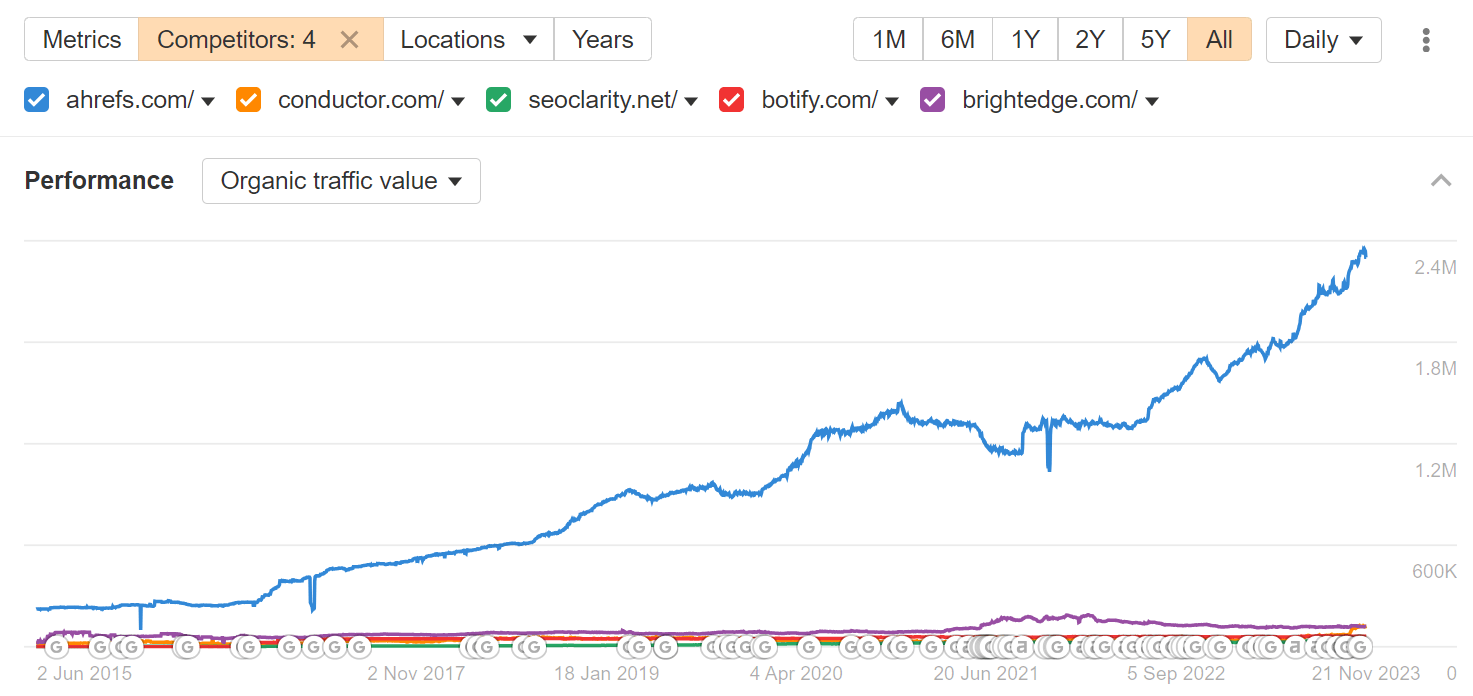
These individual metrics can also be forecast forward to estimate the future state. We have an entire post on SEO forecasting with a bunch of different scripts that let you forecast different metrics vs. competitors. This is a powerful view for getting buy-in on projects and can be done at the site or the page level.
Forecasting can be done with a number of SEO metrics including:
- Traffic value
- Traffic
- Links
- Referring Domains
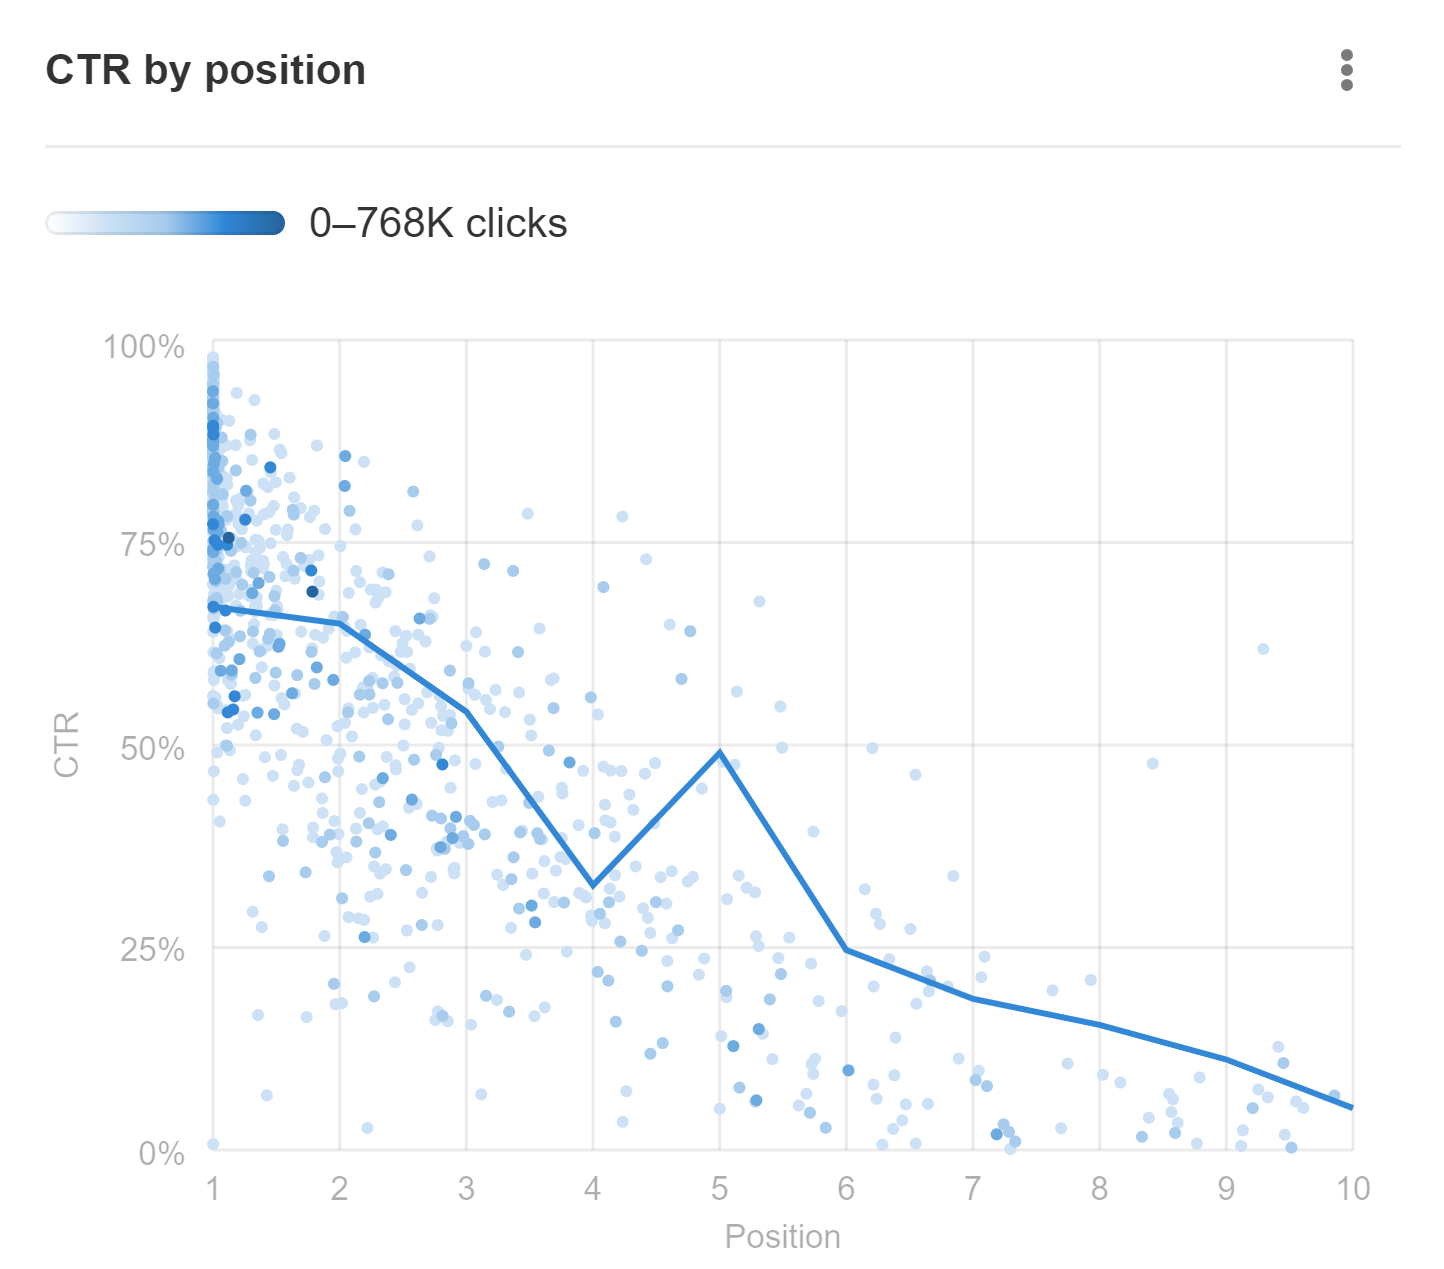
If you’re doing more traditional opportunity forecasting to sell content creation initiatives, check out our custom CTR curve models based on your own Google Search Console (GSC) data in the GSC Overview report in Rank Tracker. There are some templates to help with this type of forecasting in the previously mentioned forecasting post.
Content opportunities
You can use the Content Gap tool to find these opportunities, but you may see some repeated opportunities because of similar keywords. We will update this to add clustering and help reduce this extra noise.
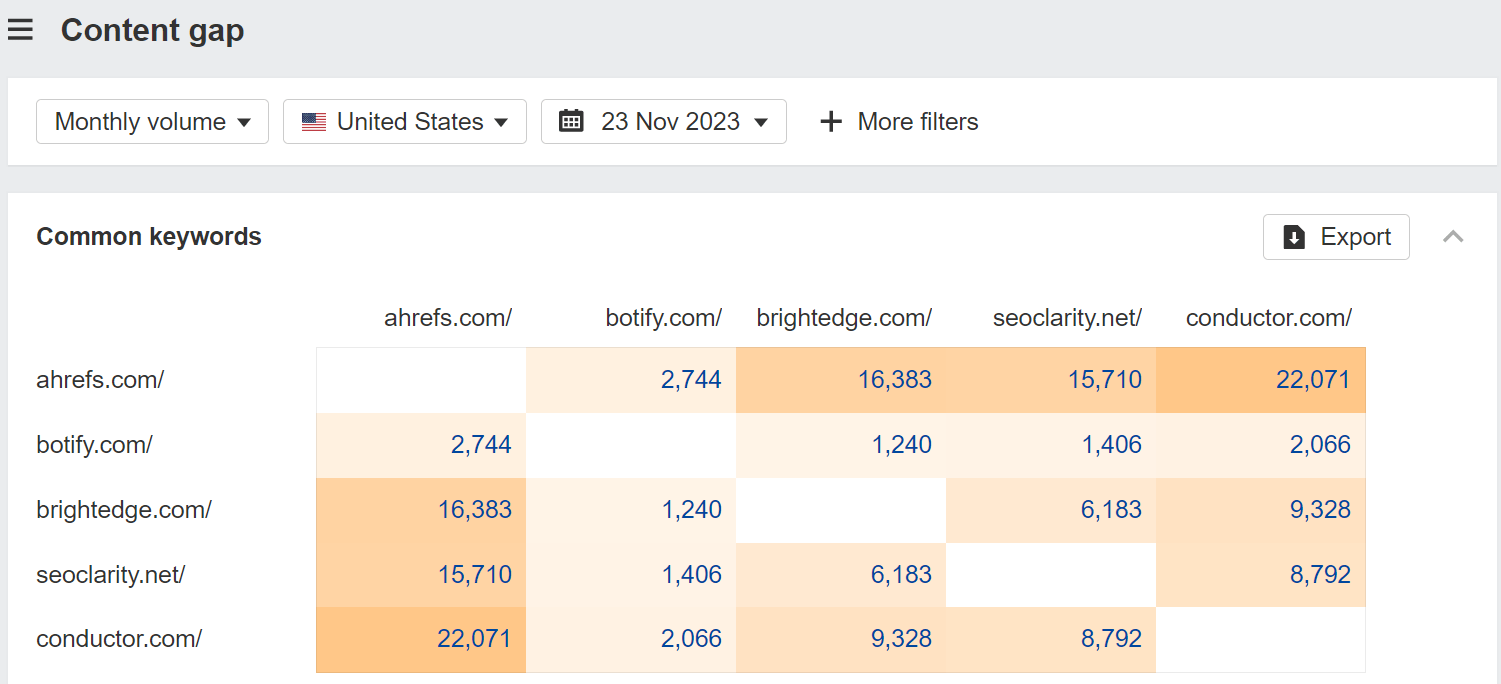
For now, you may want to export the keywords from the Content Gap tool and paste them into Keywords Explorer. Then go to the “Clusters by Parent Topic” tab. This should give you actual content opportunities you may not be covering.
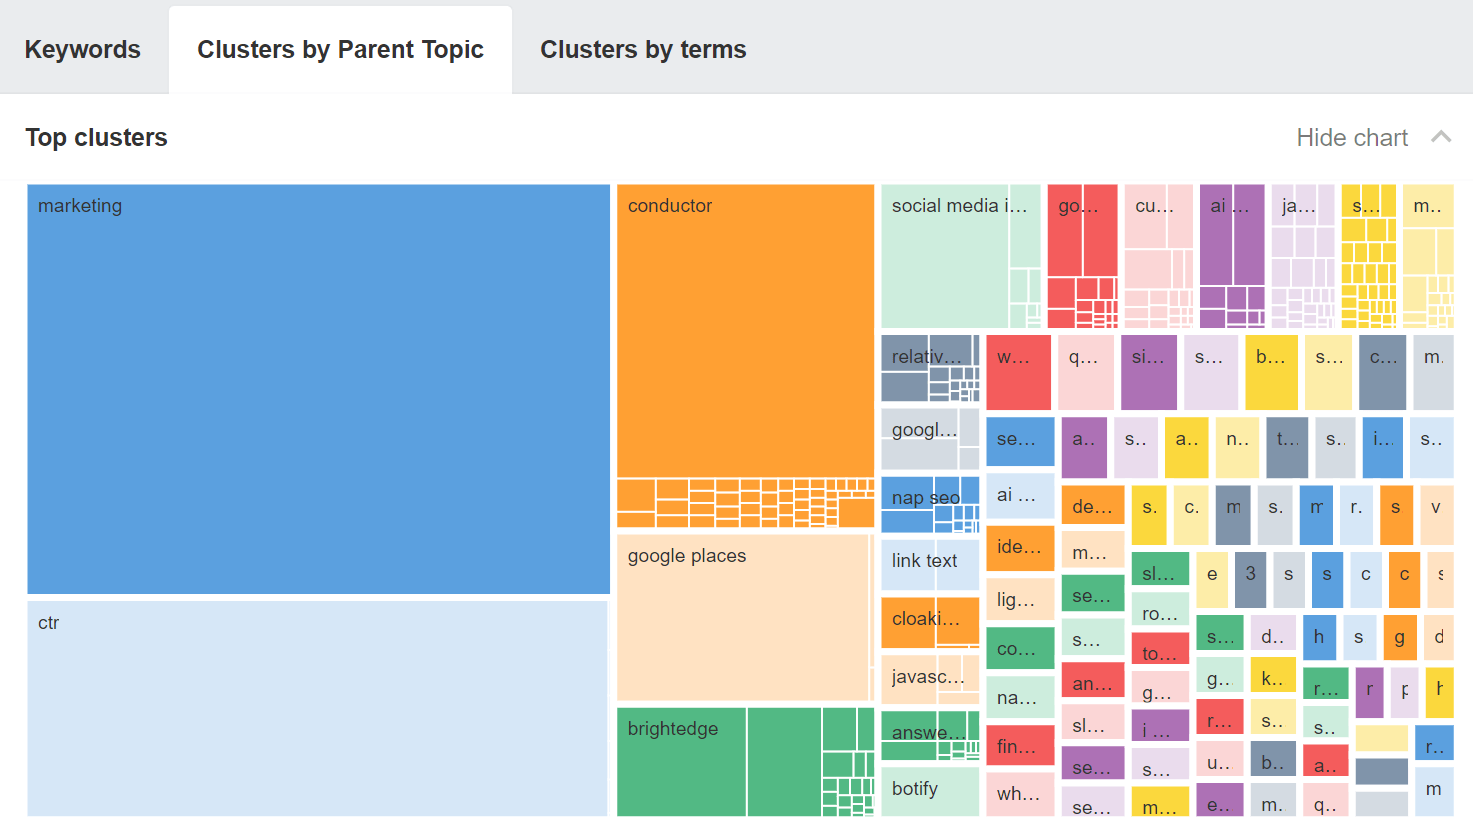
You can take these opportunities and the total volume of the clusters to use in your forecasts to come up with more accurate forecasts than those that use just one term per page. You could also just look at our Traffic Potential (TP) metric to get an idea of how much traffic a page might get.
Competition monitoring
You can use Content Explorer to keep an eye on your competitors’ newly-published pages and pages that they have updated.
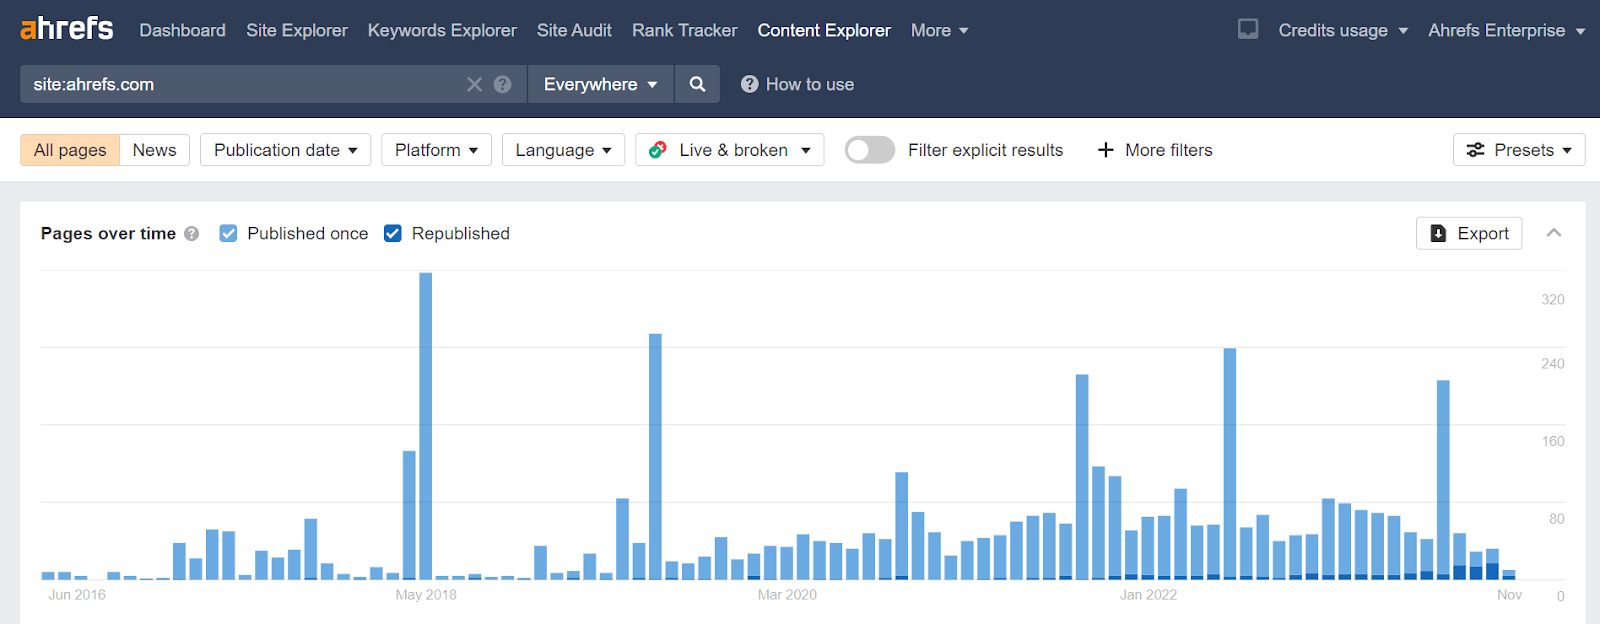
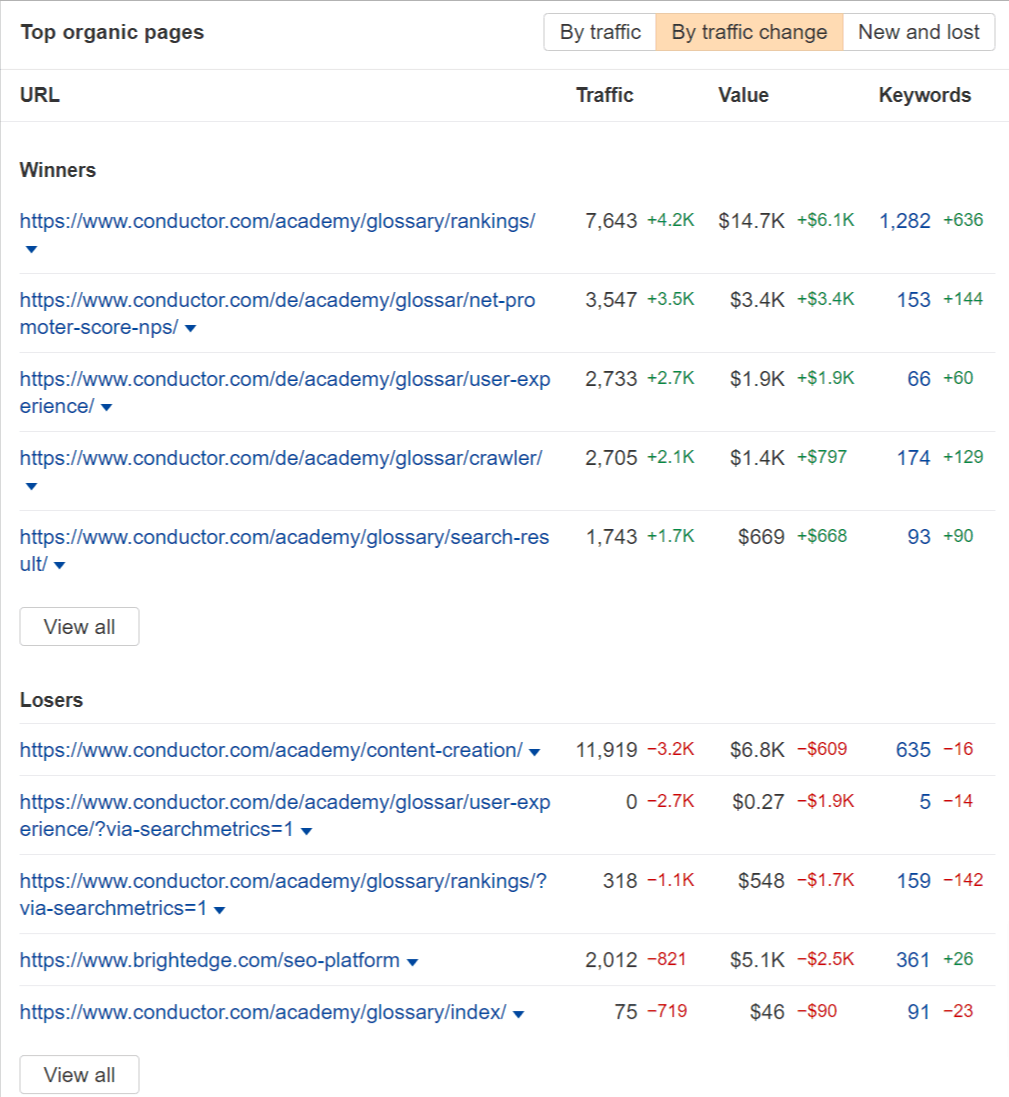
If you create a Portfolio on the Dashboard that includes competing websites, you end up with some pretty interesting views in other reports. For instance, you can get winners and losers for pages and keywords across all of your monitored competitors.
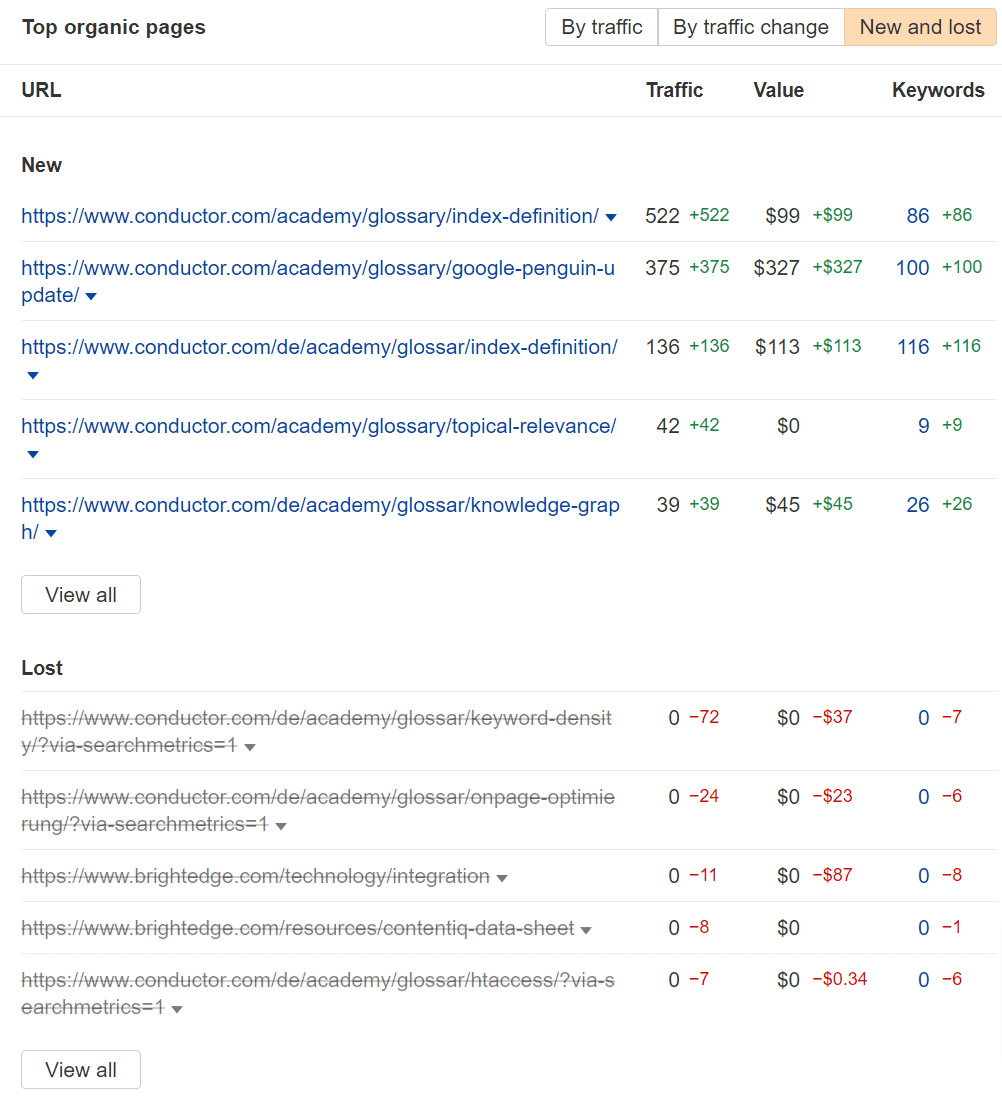
You can also see new and lost pages and keywords to see what is working well for your competitors and what they’re getting rid of.
SEO metrics for your website
Many of the most common enterprise SEO reports are based on metrics for your own website. Lots of teams and even other SEOs will want to see various SEO metrics to see how things are going.
YoY and MoM statistics
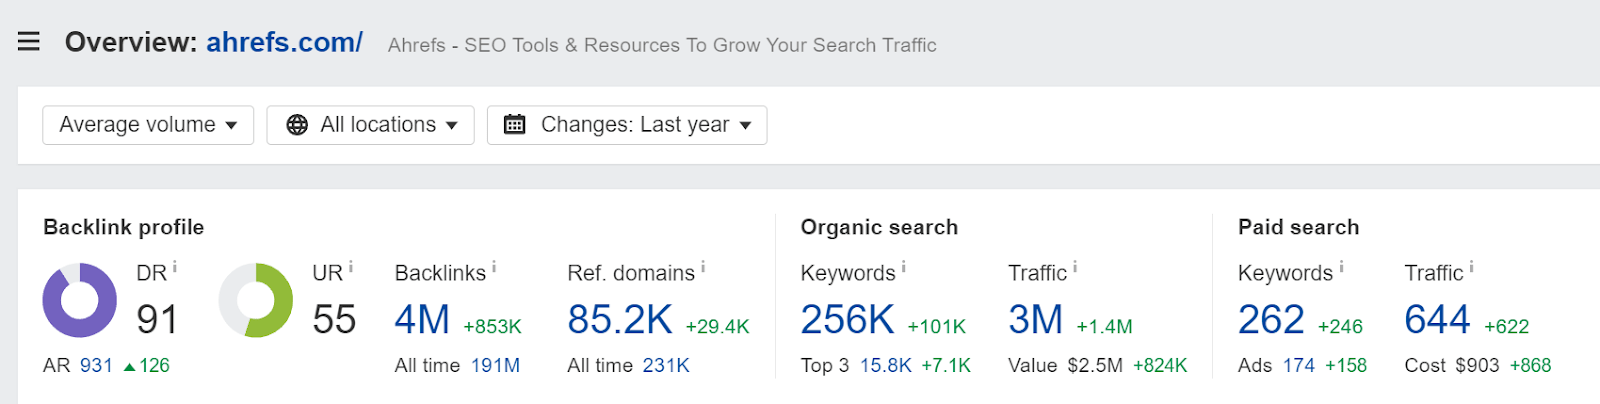
You can compare metrics between two dates on Overview. Here, you can see changes for Ahrefs Rank (AR), Links, Referring Domains, Keywords, Traffic, and Traffic Value in the last year.
YoY trends
You can also look at YoY trends for your own site. You may want to use your GSC or analytics data if you have it, but GSC is typically limited to 16 months of data. If you’ve connected it to Ahrefs though, we store and show a longer period of time and you’ll eventually be able to show the YoY data for this for multiple years.
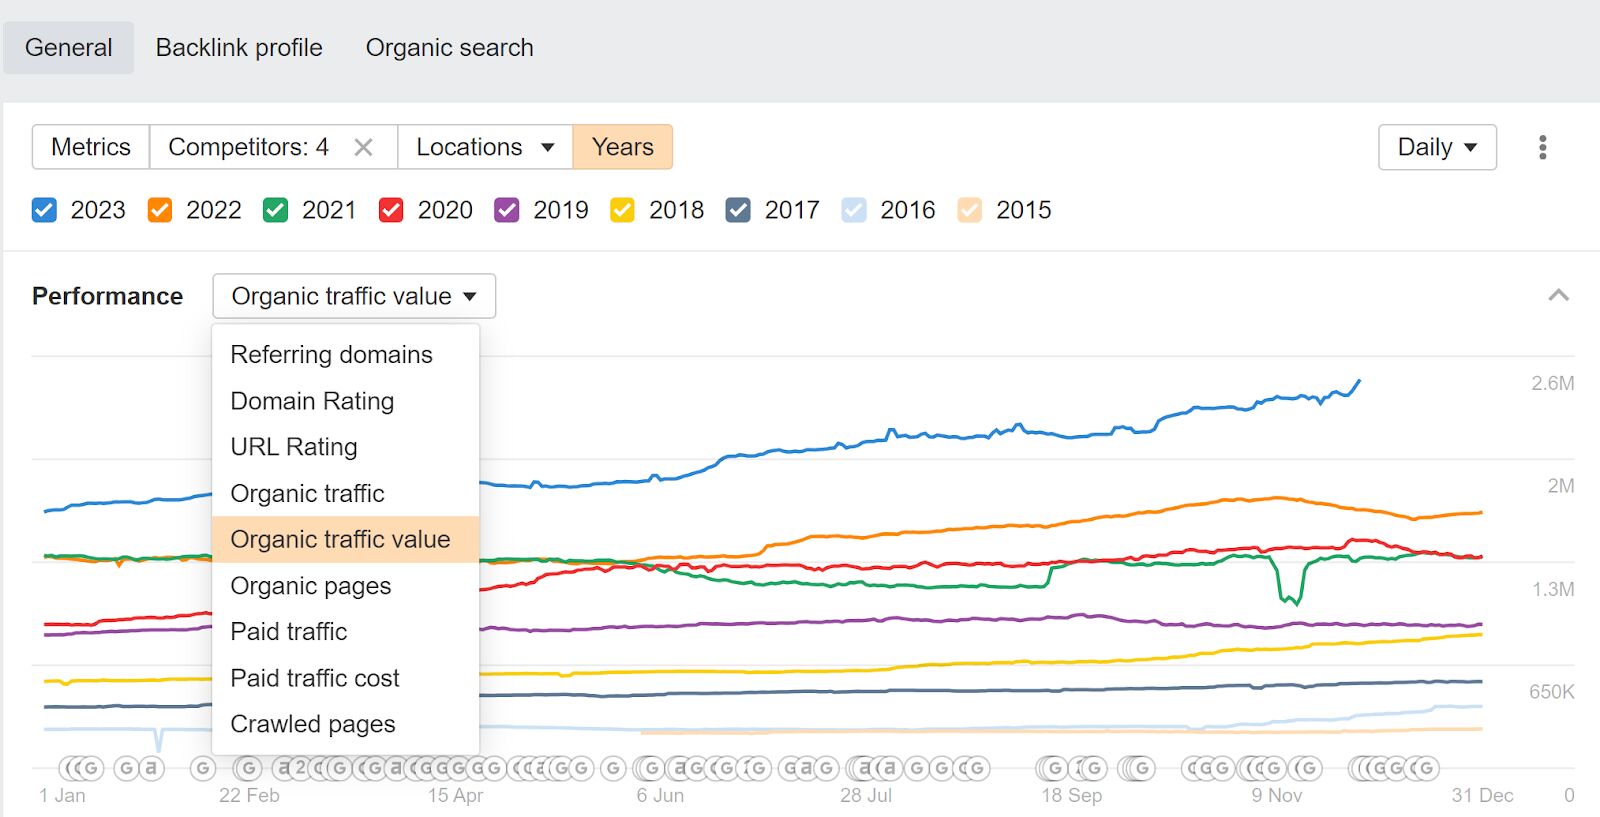
You can also use the Years tab in Overview along with average volume to show general trends or issues. We show trends for Organic Traffic Value, Organic Traffic, Referring Domains, Domain Rating, URL Rating, Organic Pages, and Crawled pages.
Brand vs. non-brand breakdown
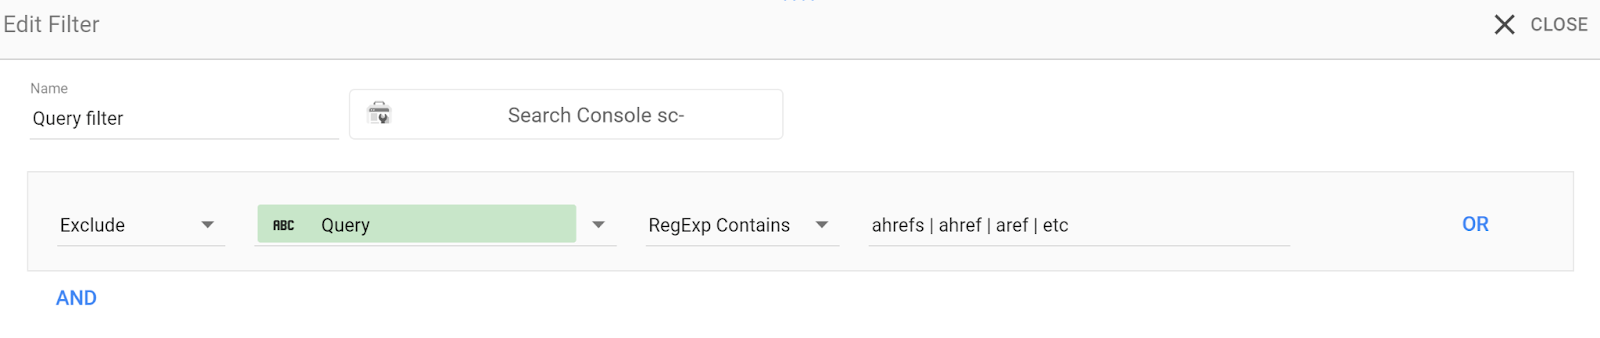
I typically split branded and non-branded terms with Looker Studio and a custom list of branded terms. You can use either GSC or Ahrefs data for it. This is what the filter looks like. You can also use the tagging system in Rank Tracker to tag branded terms and get the breakdown there.
Critical page and keyword monitoring
Enterprise companies will typically have some kind of top pages or top keywords project. These look at the most critical pages and/or keywords for your business and help you see their performance over time and any trends or issues.
They’re typically used in meetings where there is a quick analysis and an action plan created for any issues or for any successes. You try to look at what worked well so you can replicate it, and try to look for any issues to see what happened.
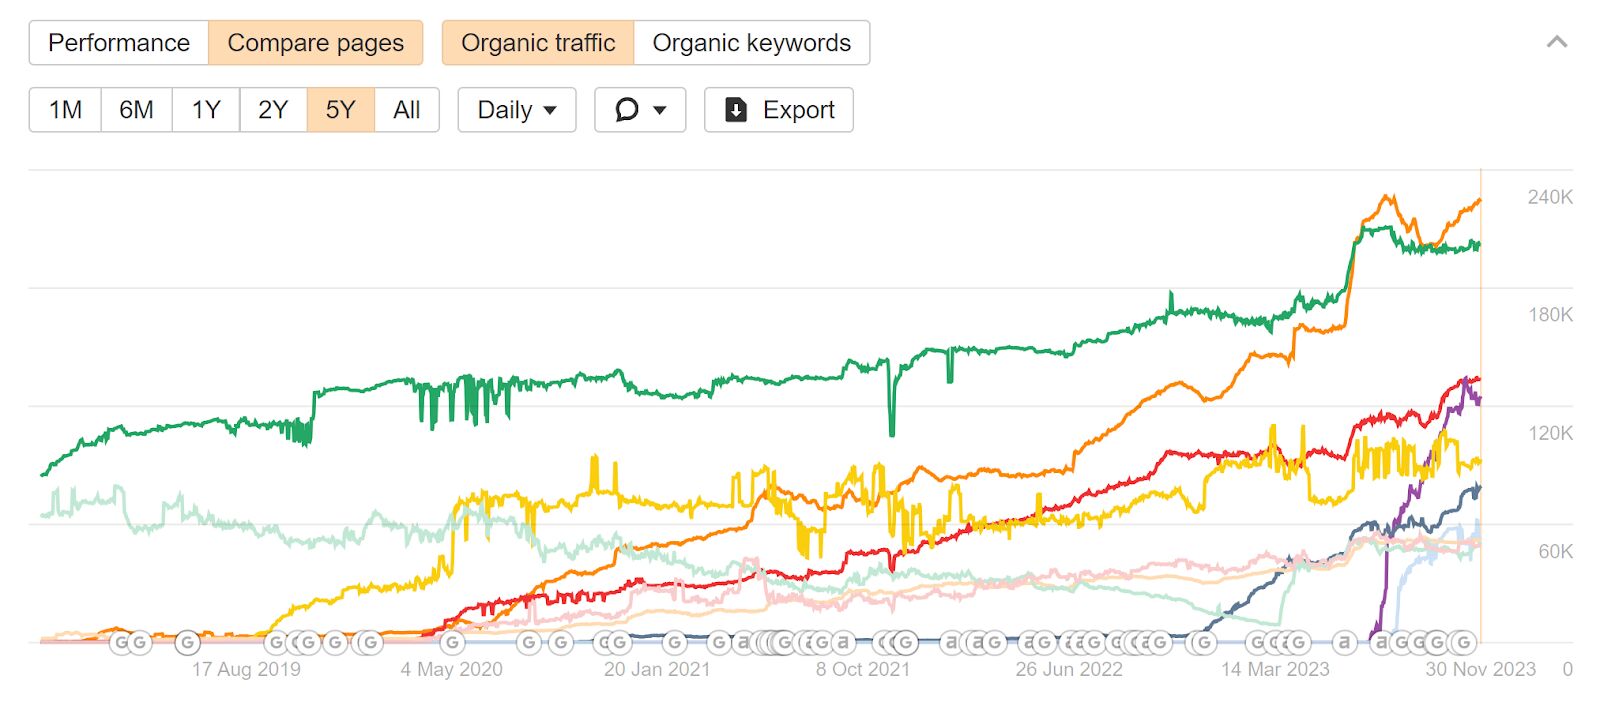
You can use the Compare pages tab in the Top Pages report in Site Explorer to get this kind of view for your pages. We will be adding one for the Organic Keywords report in the future as well.
Enterprise SEO scorecards
We already talked about competitor SEO scorecards, but there are also normal SEO scorecards that you can use to monitor performance and compare one group to another or one section of a site to another.
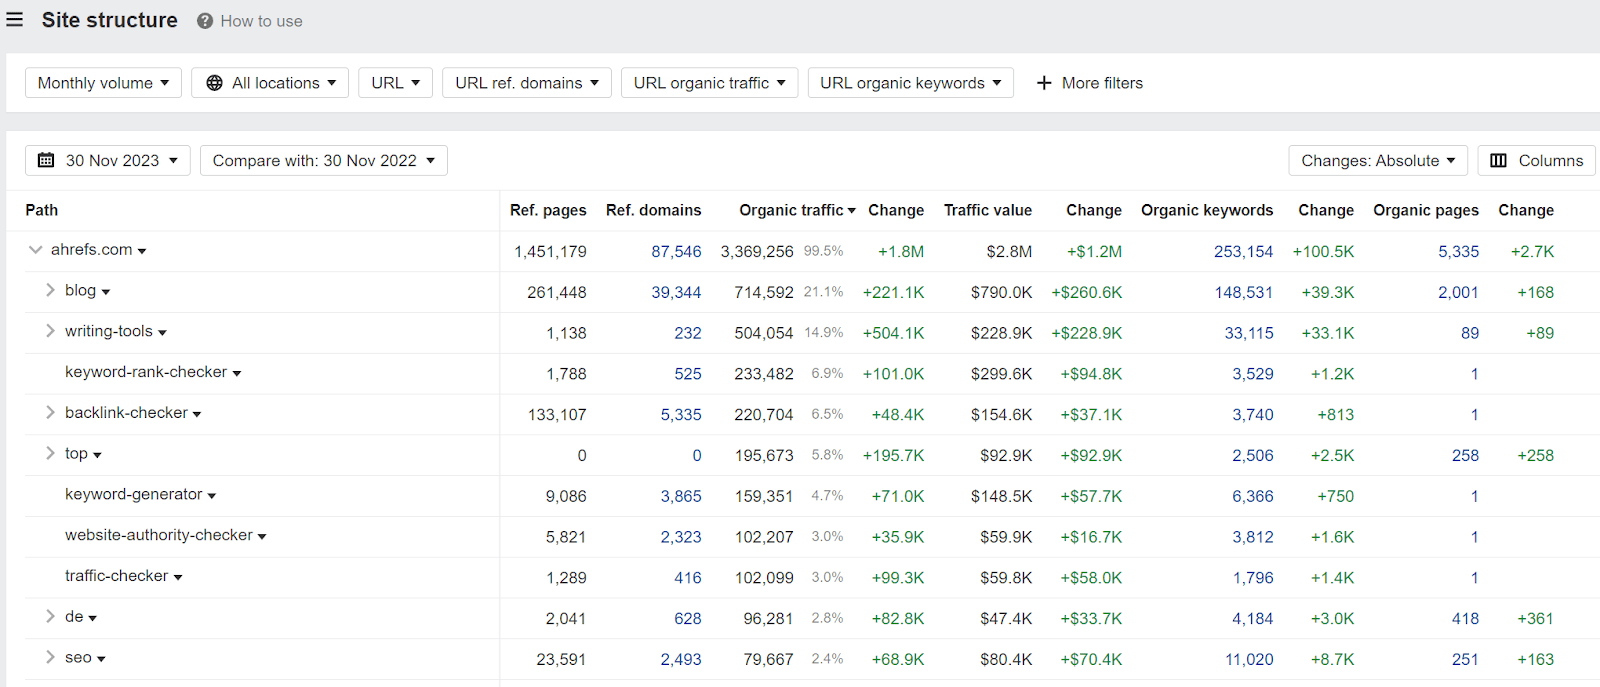
Our Site Structure report in Site Explorer has a lot of the information you’d use to create this scorecard view. You can even compare between two dates.
The columns are customizable so you can show only the metrics you need. We have Referring Pages, Referring Domains, Organic Traffic, Traffic Value, Organic Keywords, and Organic Pages available.
You can pull technical issues from Site Audit where you might want to show health scores over time for different sections of the site, Core Web Vitals, or general errors. In the past, I’ve created views that showed the number of pages we still need to redirect, Core Web Vitals scoring, and pages that have too many redirect hops.
You can also create custom groupings of pages using our Portfolios feature. If you have a business unit or product offering that owns some pages on the blog, some pages in the product section, some pages in support, etc., then you can add them as a Portfolio to get a rolled up view. Portfolios support up to 10 different domains and 1,000 different pages or paths.
Rankings
Rank Tracker allows for custom segmentation via a flexible tagging system. You can have branded and unbranded, specific product or business unit tags, authors, top 20, or any number of groupings for your own use cases. There are a number of different things you can track, but lots of people typically want to see rankings.
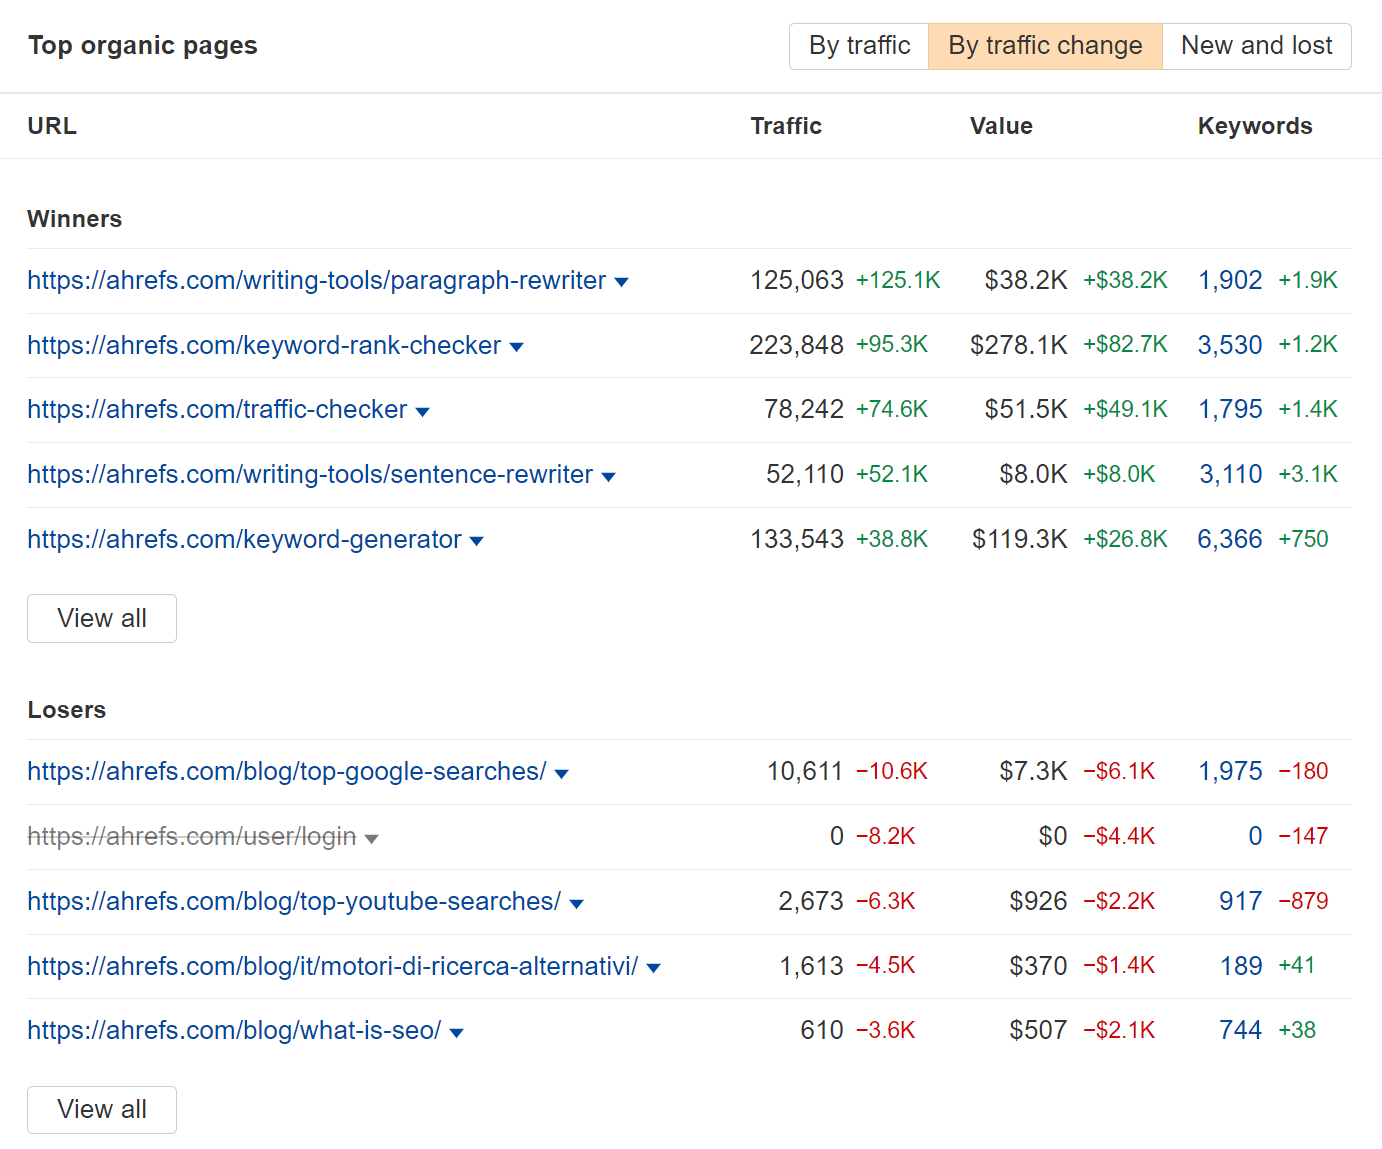
Winners & losers for pages and keywords
You’ll want to check your own pages and keywords to see what’s working well and what’s not. You can do this on the Dashboard or with filters on the individual reports to see more data.
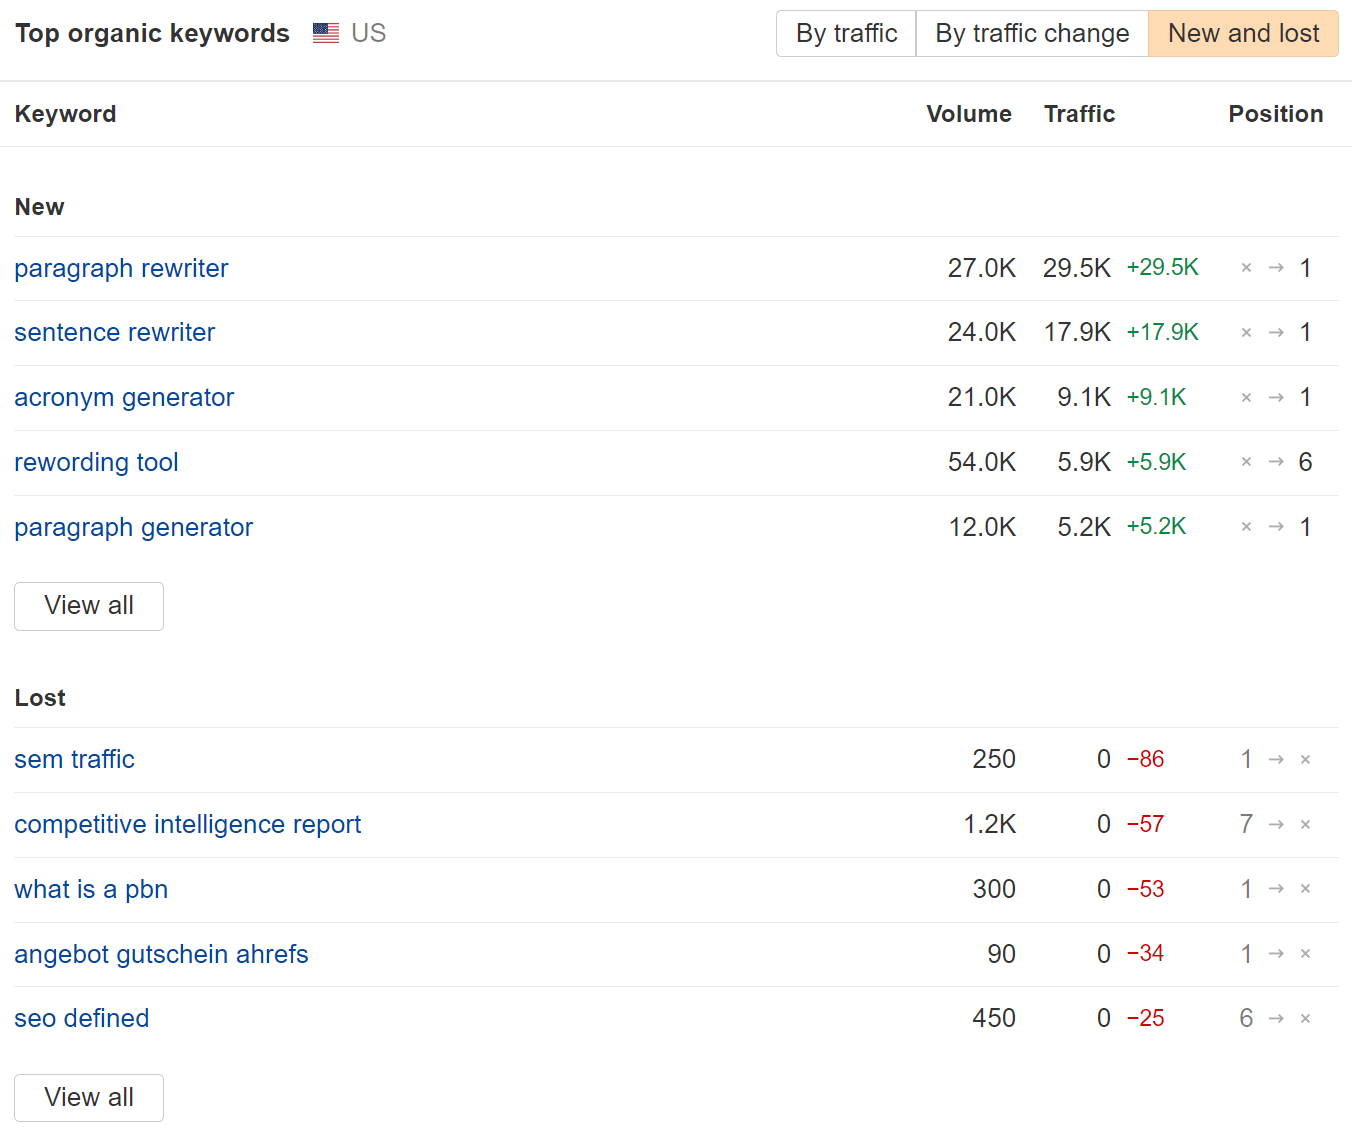
New & lost for pages and keywords
As an enterprise SEO, you can’t be everywhere at once or have visibility on every project happening on the site. You can use the new and lost reports for keywords and pages to help monitor what is changing on the site. Again, this is available on the Dashboard or you can filter for them in the individual reports like Organic Keywords or Top Pages.
Content performance
If you’re running A/B tests, improving a group of pages, or want to monitor different authors or even business units or products who may have multiple sections, you can use the Portfolio feature on the Dashboard to add up to 1,000 pages or sections across 10 domains.
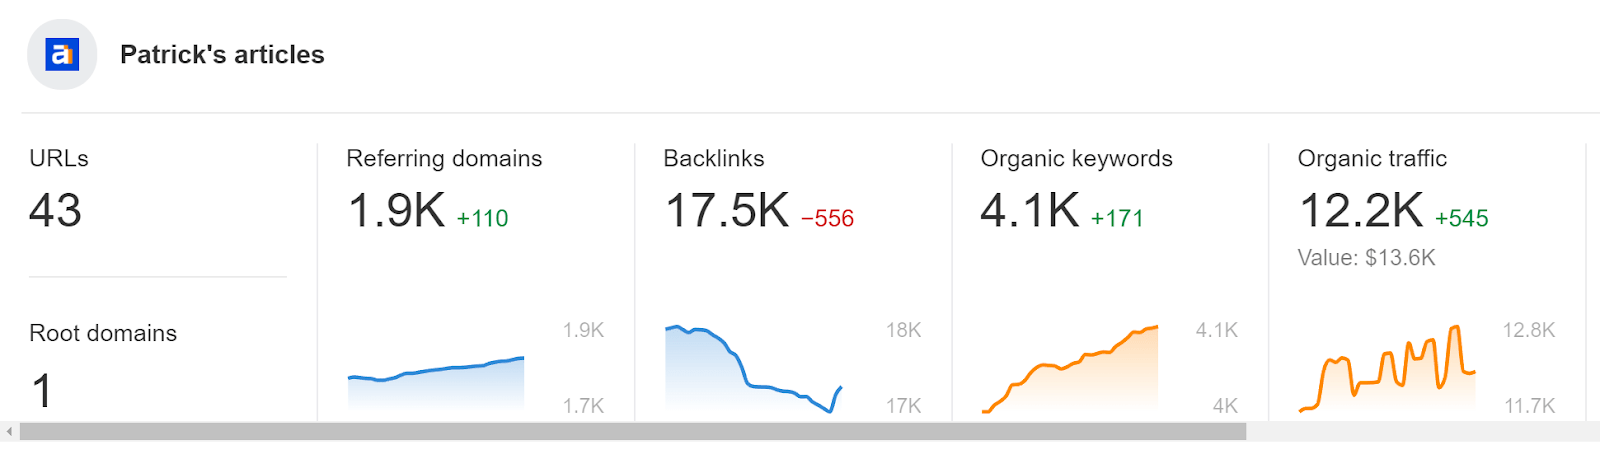
Many of the reports in Site Explorer will give you rolled up views of the content. Now you can easily see if your tests or improvements had an impact or create a scorecard view for different authors or parts of the business to check how each is doing.
You may want to report on content scores for top pages or averages across pages or groups of pages or authors to show that your content is improving. We’ll be able to help with this soon.
Index coverage errors
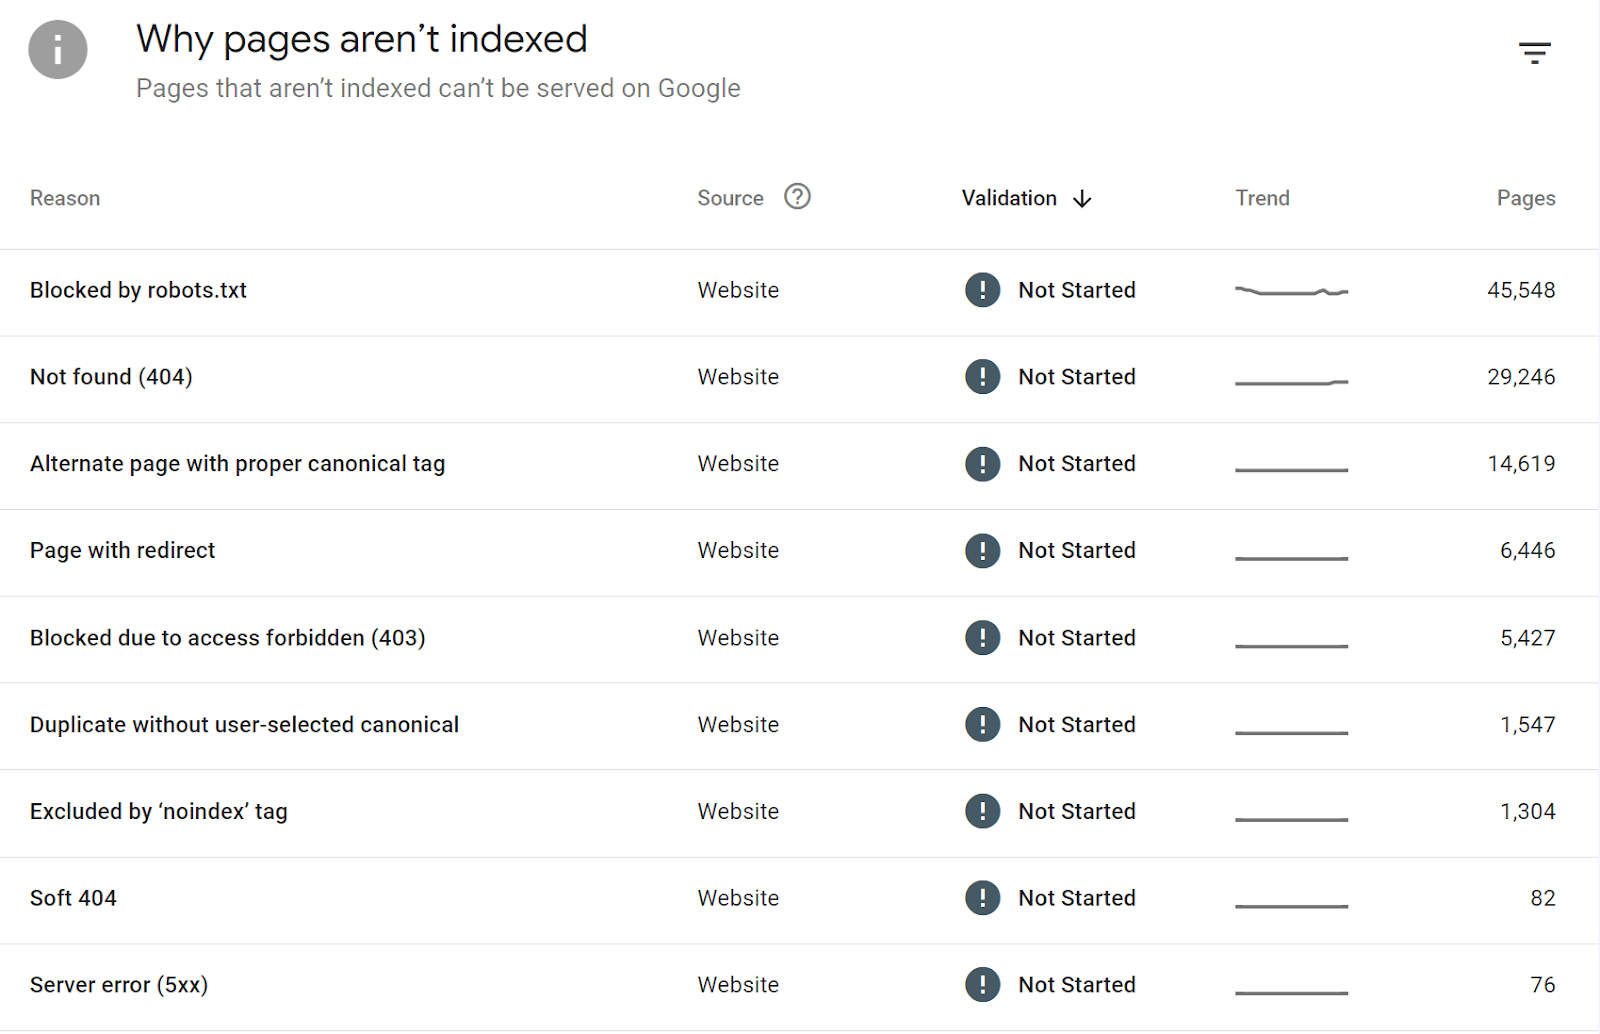
Check the Page Indexing report in GSC. It shows you how many pages are indexed and not indexed and has different buckets telling you why pages aren’t indexed.
Status or project reports
Your boss and execs usually want to know what you and your team are working on and how things are going. For instance, you might report on the progress of any initiatives like 3/9 planned projects completed, you improved website health by three points, etc.
You might also want to create impact reports. For example, let’s say you’re running A/B tests for related things in a group of pages. By adding these pages to a Portfolio on the Dashboard, you’ll be able to see improvements or compare any two dates to better see the impact of your testing.
Almost every company has projects around creating new pages or updating existing pages, so you could report the numbers for those. This type of report could really include anything like indexing issues fixed, outreach emails sent, etc.
You might want to create these in scorecard views as well so that you can see the progress different products or groups are making towards initiatives. That way you can see if someone or some group is stuck and figure out how you can help them make progress.
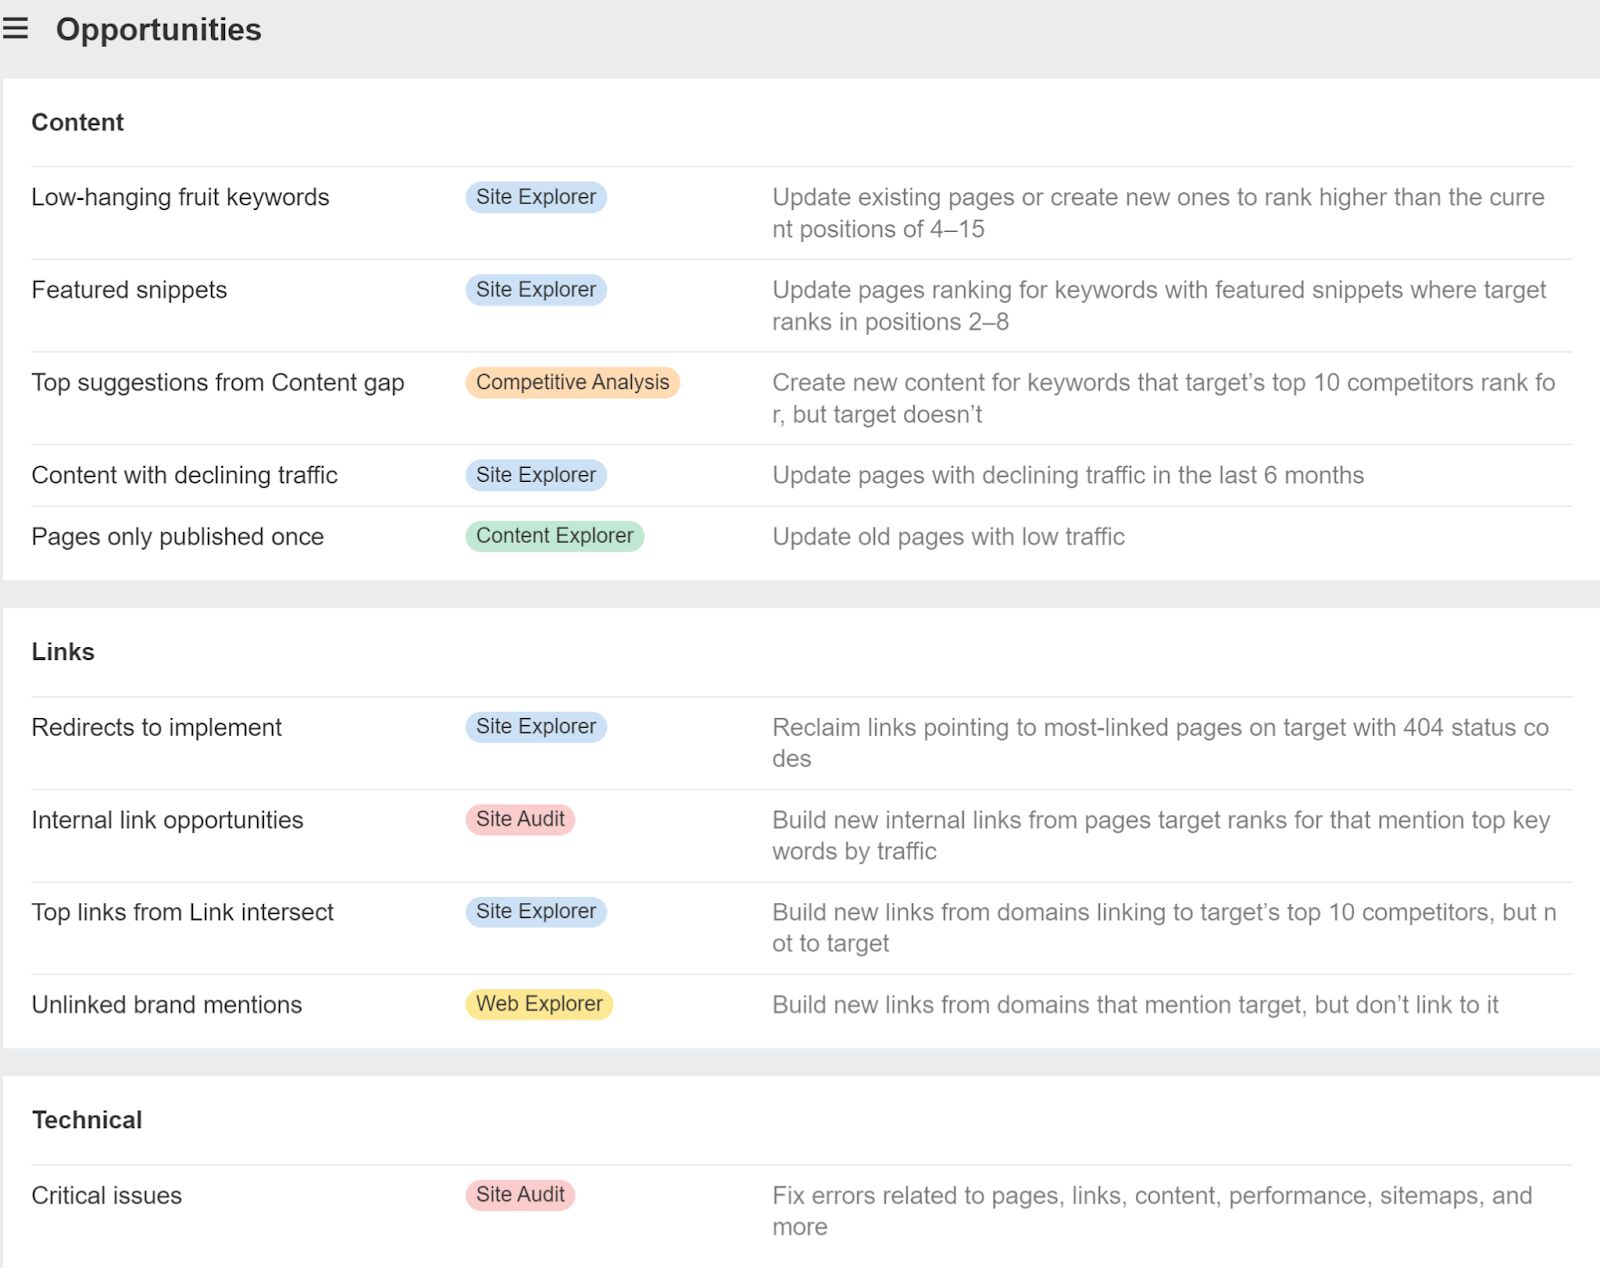
Knowing what to prioritize is the hardest part of SEO. We created the Opportunities report to help you work on things that will move the needle. If you’re not sure where to start, look at these reports and measure progress towards the opportunities shown and you will likely show a lot of success to your stakeholders. This report is a great starting point for an enterprise SEO audit.
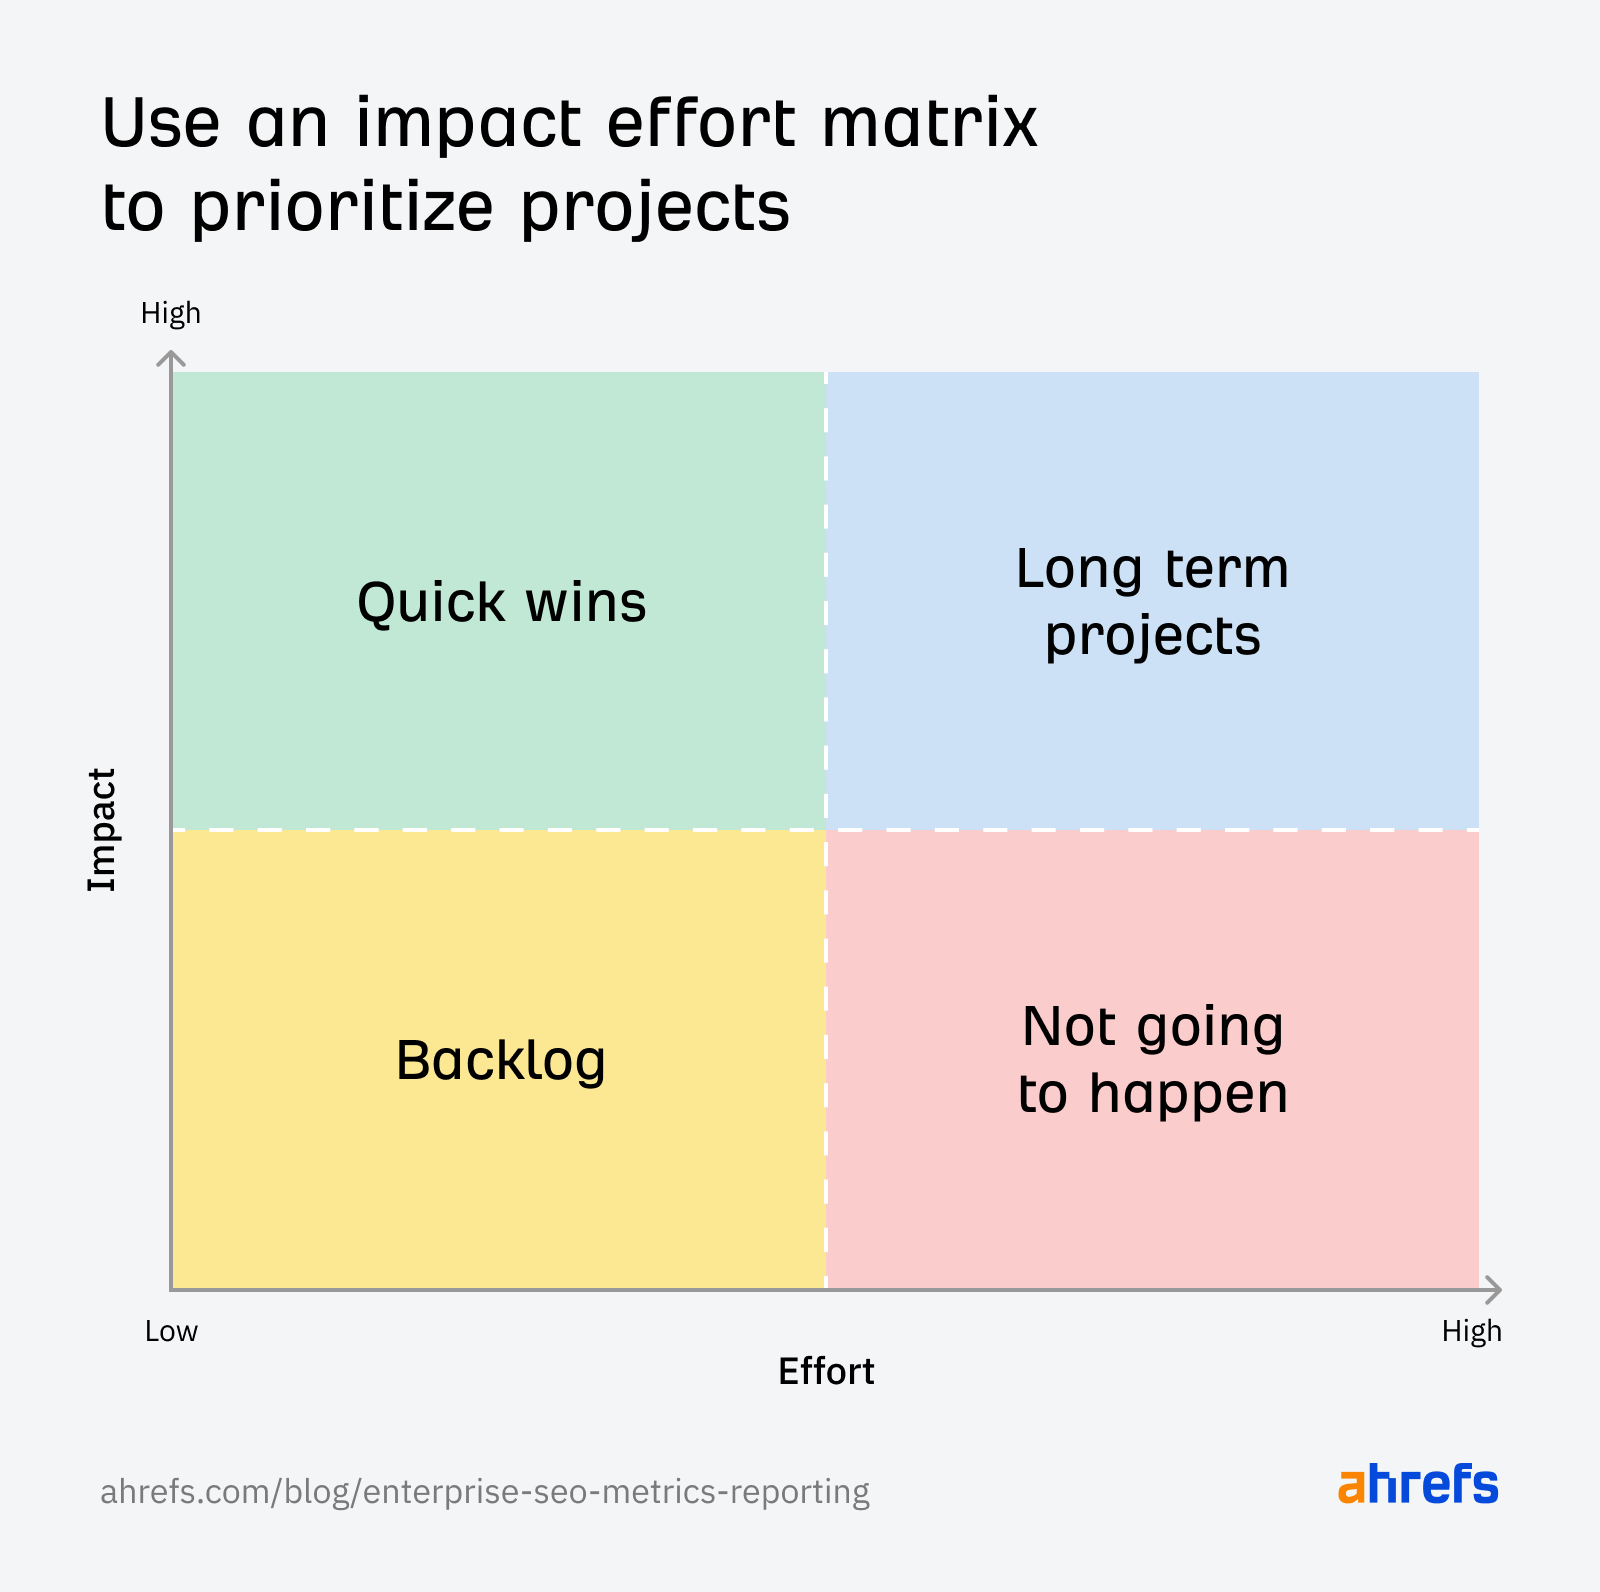
You could also work with the in-house team or the dev team if you are in-house to create a visualization of what you consider the most important and impactful SEO projects. I normally use an impact / effort matrix for this to show how hard projects are and their estimated impact. Based on their coordinates, it’s easy to see which projects you should prioritize.
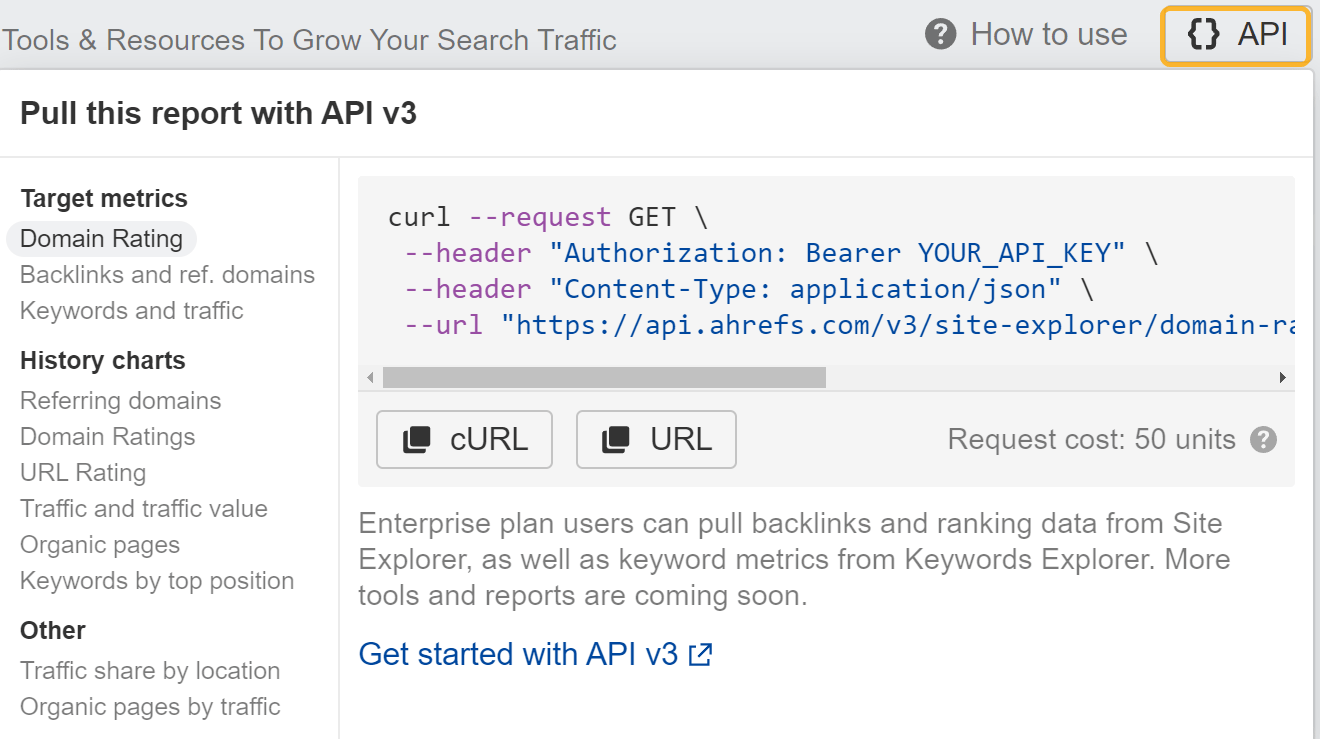
In most of our reports, we have an API button that will let you pull the data needed from the reports to re-create the visuals we have or any custom ones you want to create in your own reporting platform. We tried to make this as easy as possible for everyone. You can also check our API documentation for any custom data pulls you might want to make.
We also have Looker Studio templates you can use to create your reports. These are customizable and well documented.
منبع: https://ahrefs.com/blog/enterprise-seo-metrics-reporting/

